You can create graphs with Visual Data by visiting its website:
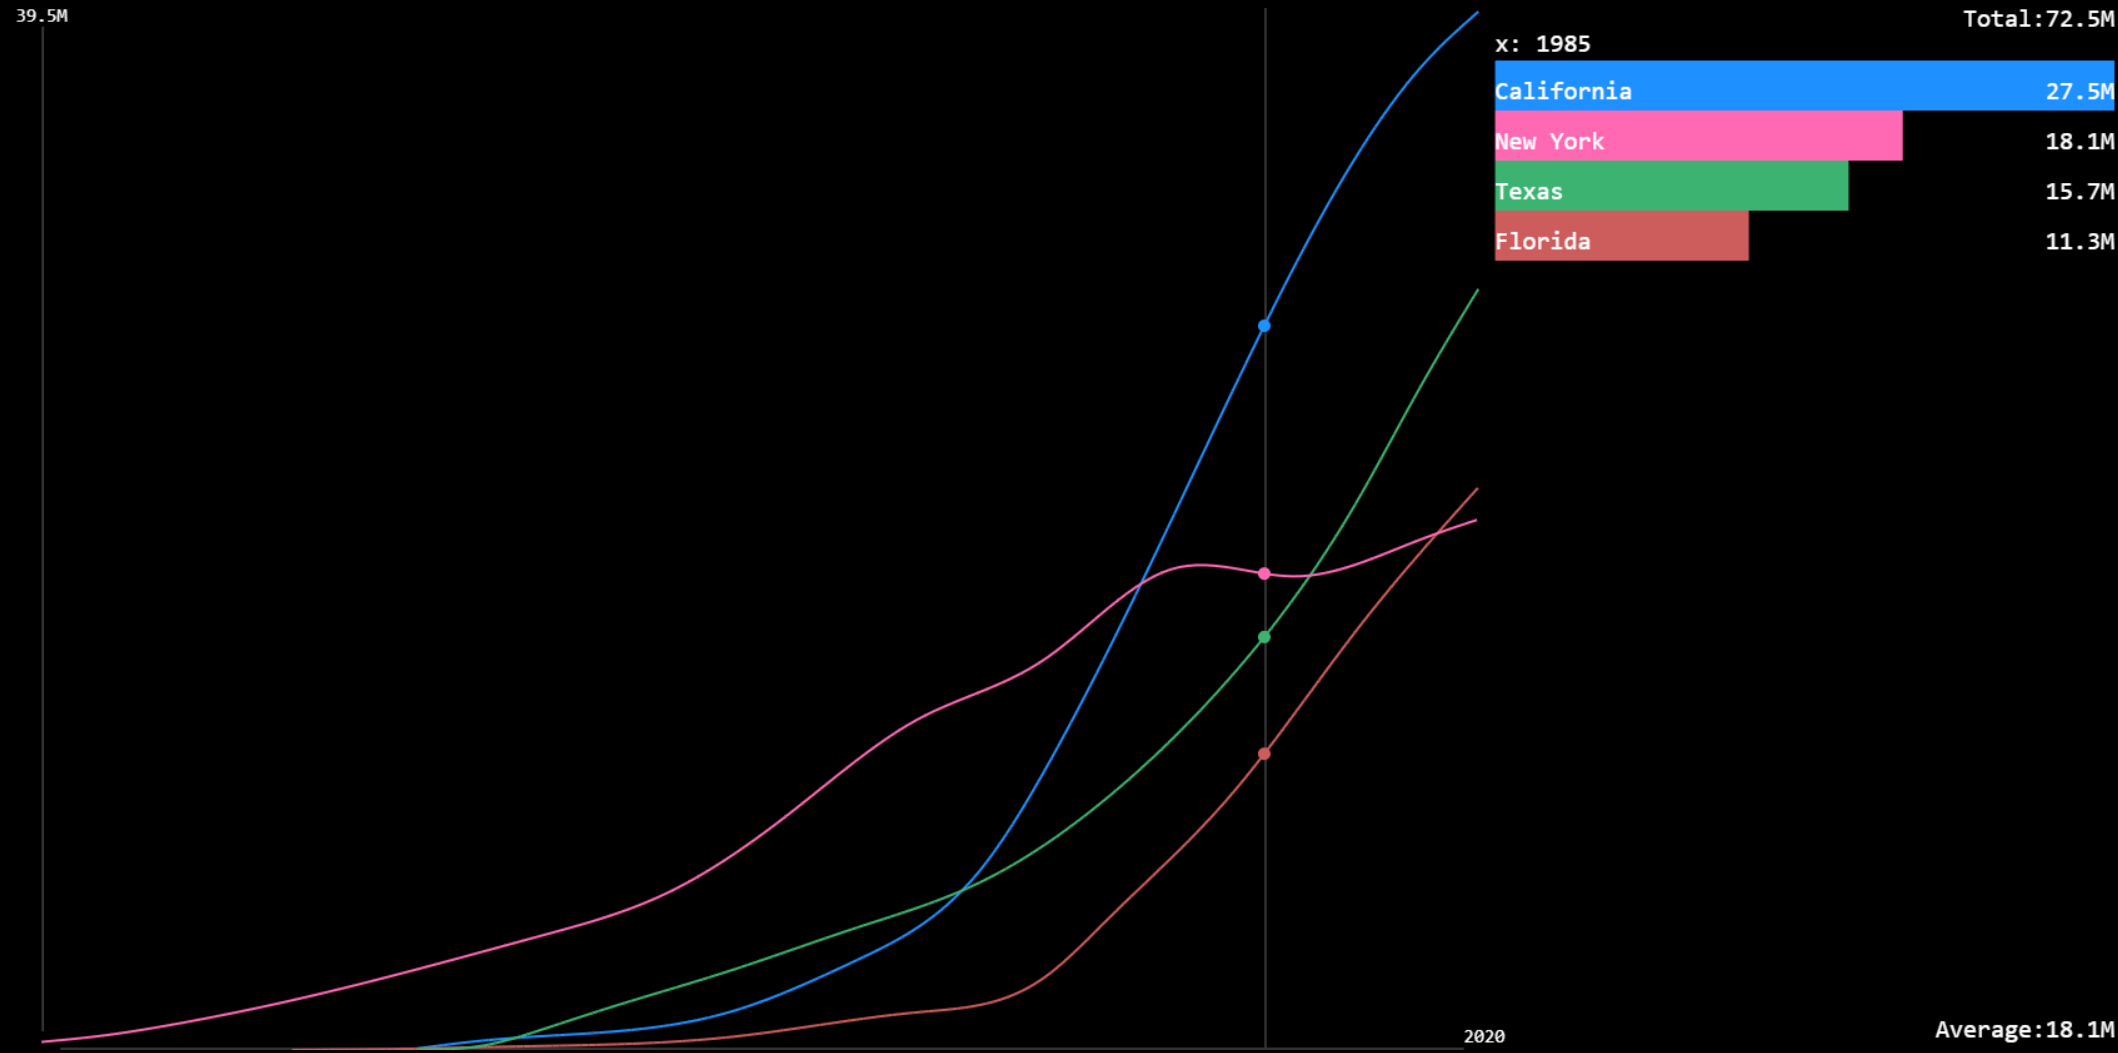
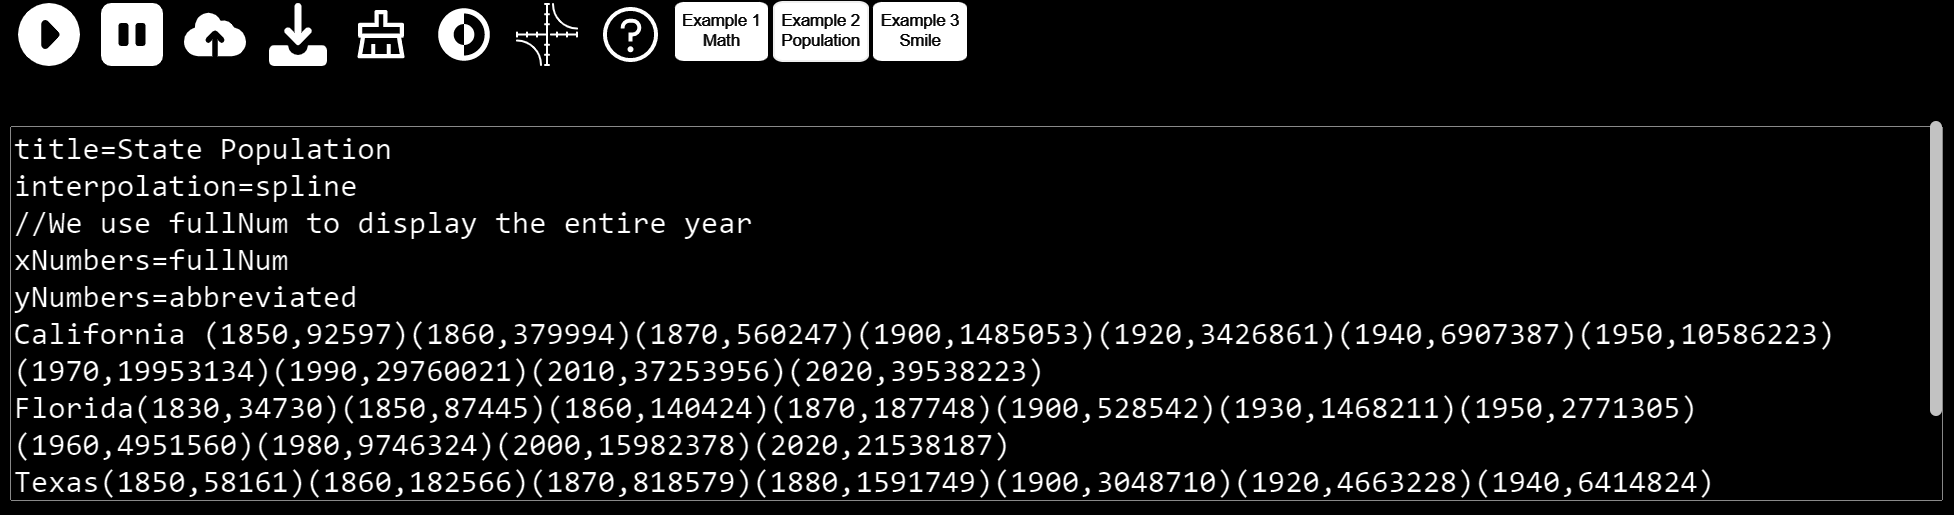
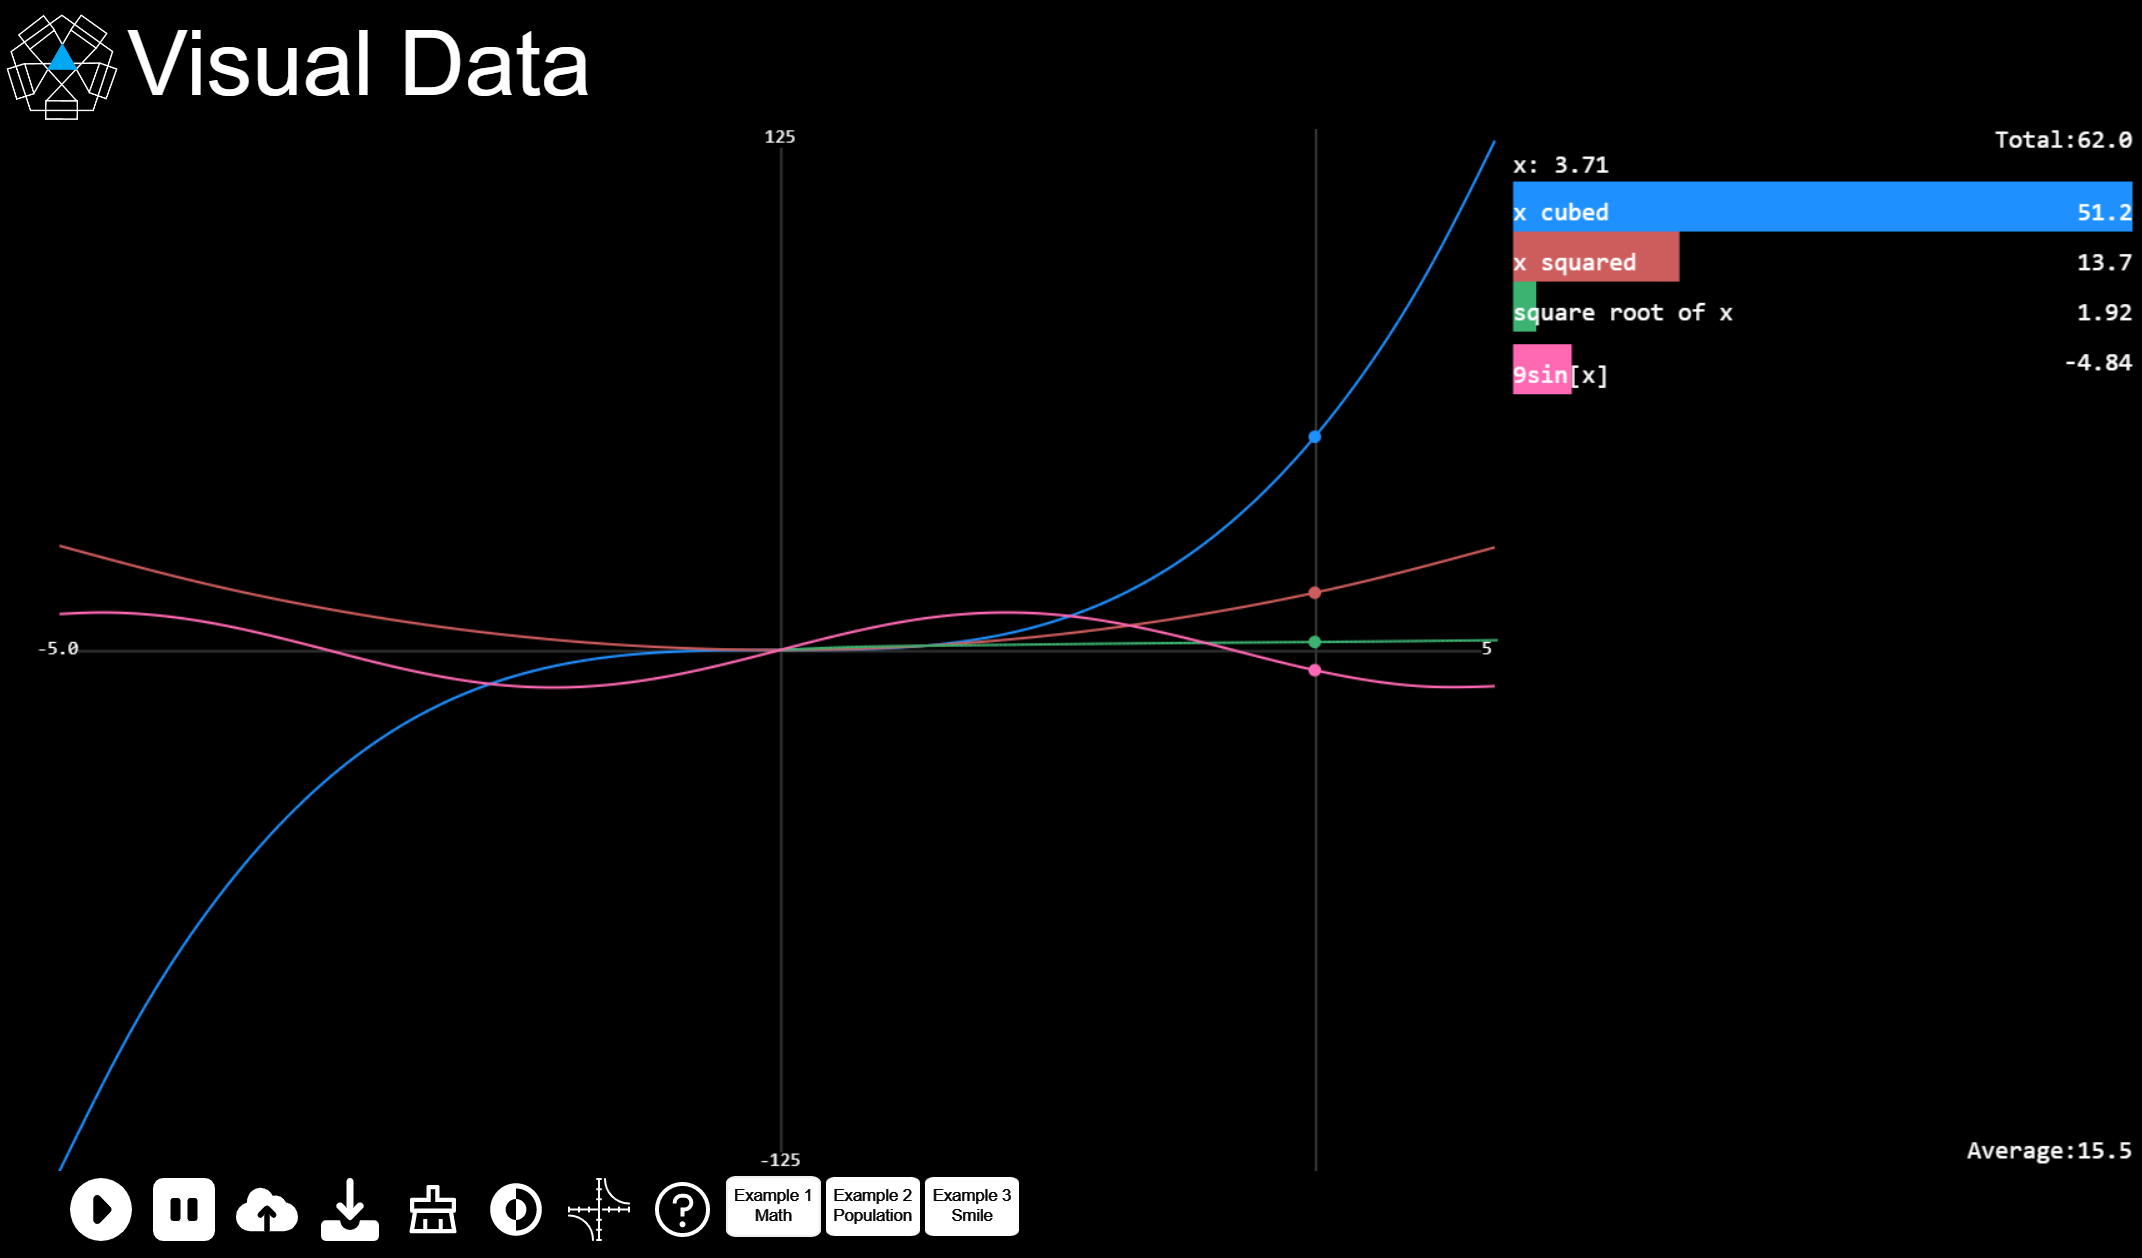
Visual Data is a program I made in 2022 that turns data points into an interactive graph and bar chart that can be animated. You can either upload a text file, or use the textarea provided to write out as many sets of data points as you want, with each new set being on a seperate line. You can hover over points on the graph to see what the y and x-values of each function are, and you can also download your file once you are done.
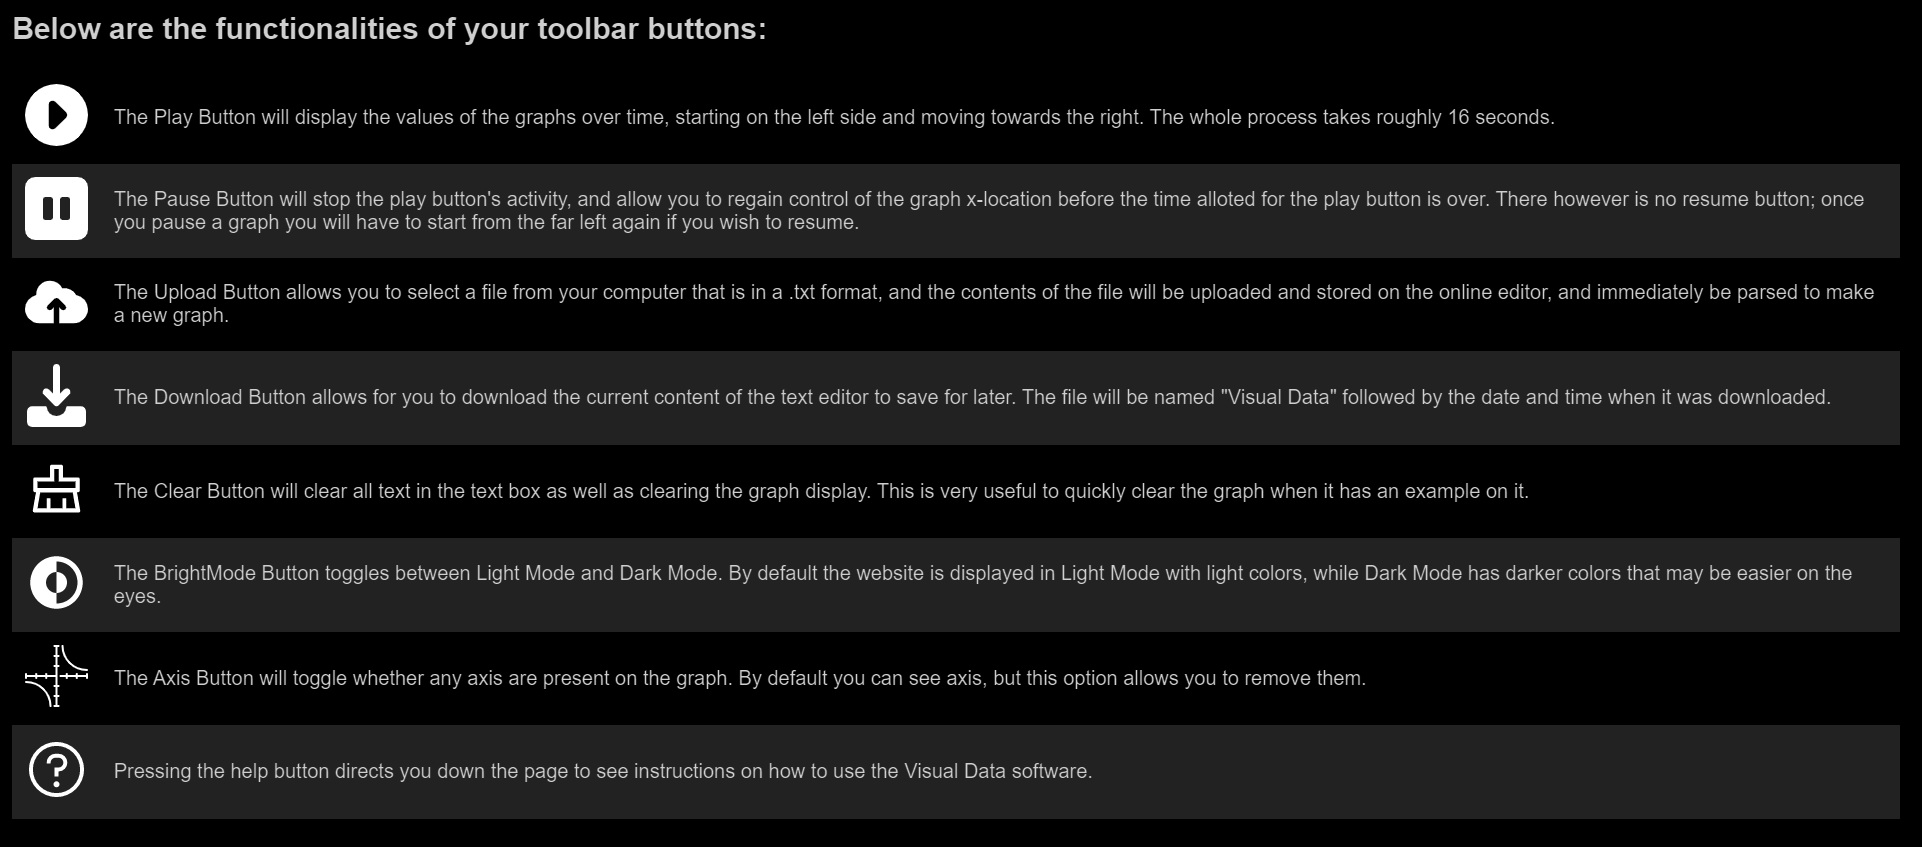
A few different example files are provided to showcase the capabilities of the site, and allow users to begin experimenting with it out of the box. Instructions are included on the website as well, detailing other features such as removing axis indicators and activating a website dark mode.
This site is designed purely for Desktop, while it may work on some mobile browsers it is highly recommended to only use Desktop to ensure the site functions properly.
Visual Data does not use any code libraries, and the Visual Data logo was designed by myself. Credit goes to svgrepo.com for the icons within Visual Data.
I have enjoyed looking at infographics and data for a while, and one thing that really caught my attention were "running bar charts", which are animated bar charts that have changing values for each individual bar. Animated bar charts are really helpful for comparing growth between multiple subjects, such as showing population growth by country in a visual way. While there were plenty of resources online for making your own running bar chart for free, they sometimes had a fixed axis making it hard to show different function domains and additionally didn't display any other graphical output, such as a graph that makes it more helpful to see overall trends. Taking this into account, I decided to program "Visual Data", allowing users to input points that have both an x-position and a y-position as opposed to a string of y-values, and displaying the entire output on a graph.