The website is located at the following URL:
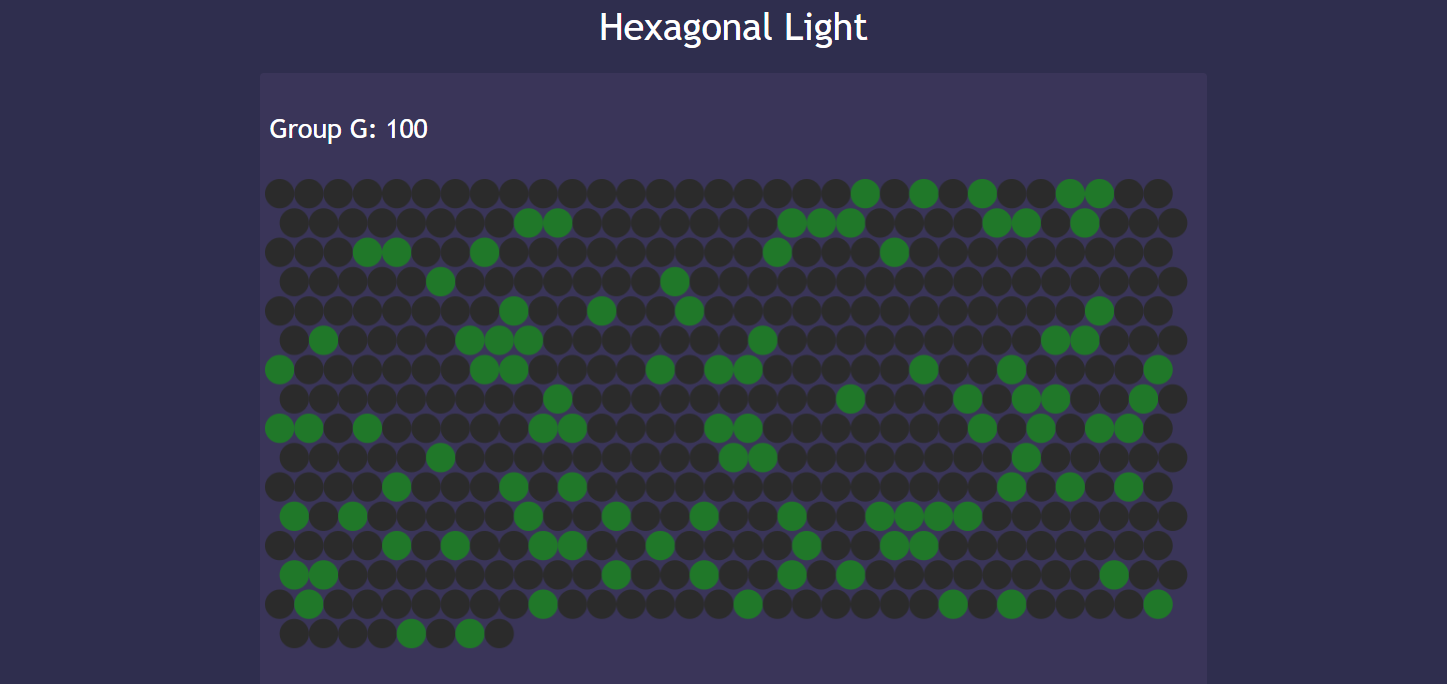
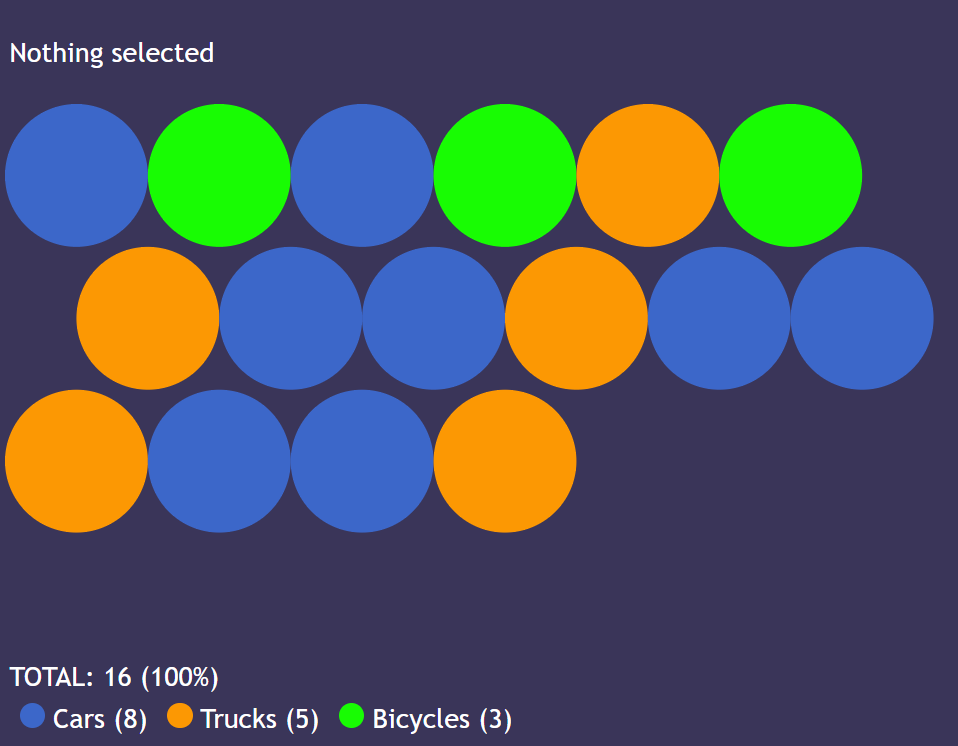
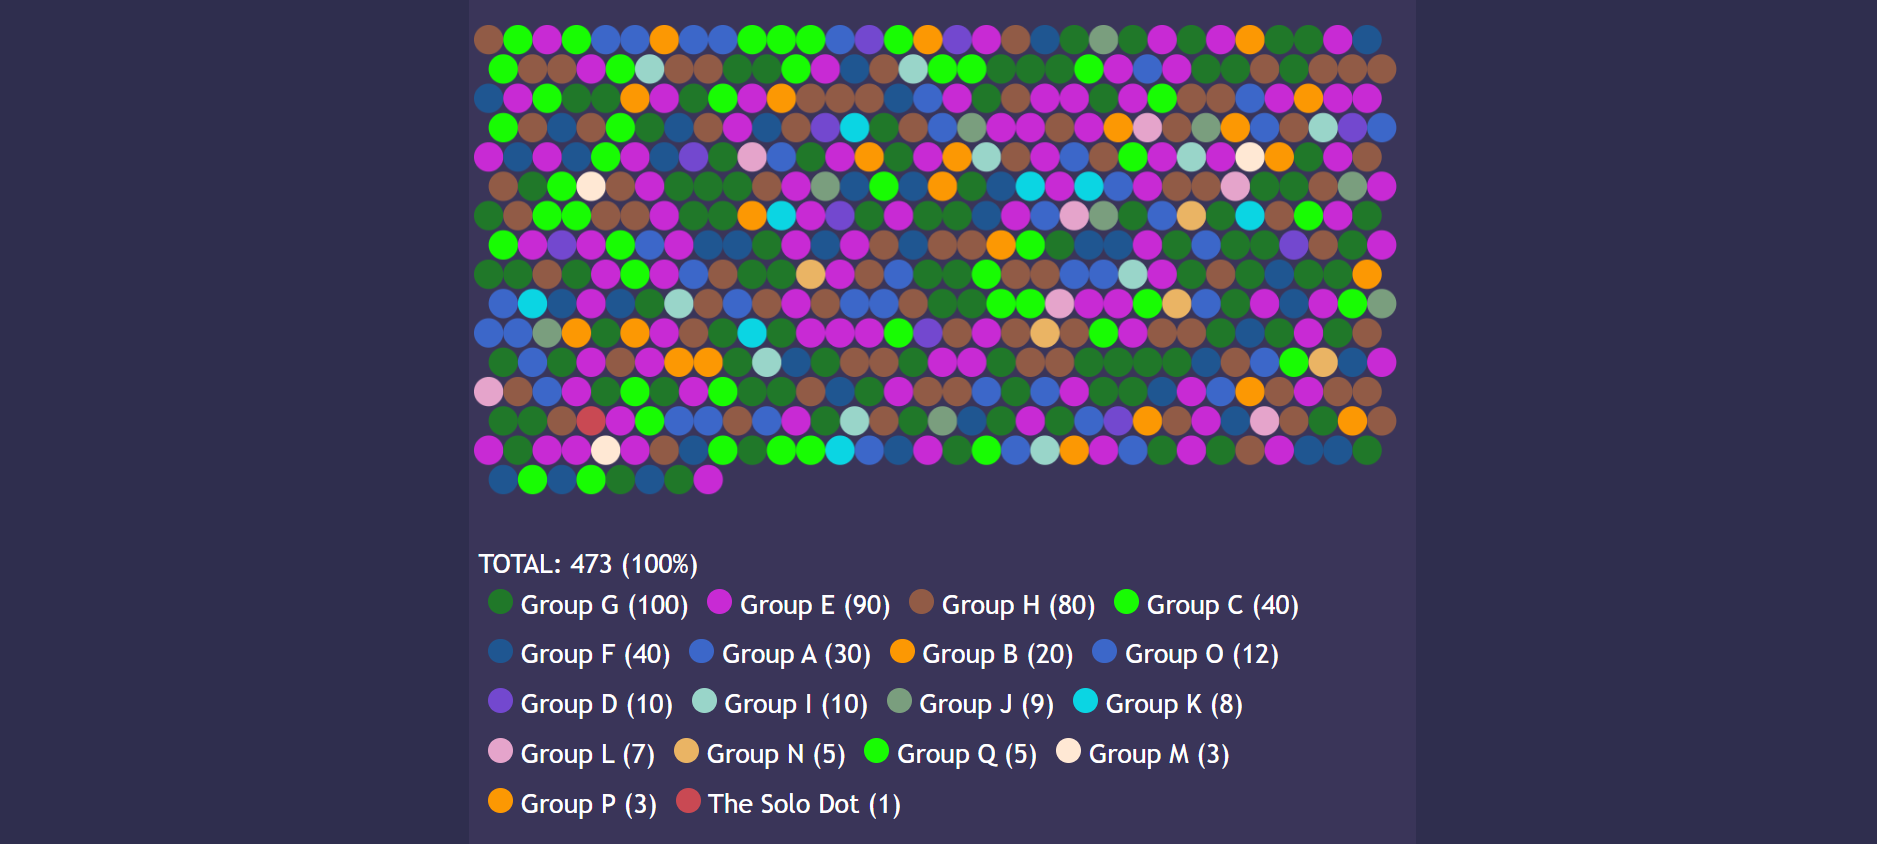
Hexagonal Light is a program I wrote in 2023 that creates interactive charts for categorical data. A graph shows a bunch of circles, with each circle belonging to a categorical data group. Users can view each group individually to get a visual sense of how prominent a group is in the entire dataset, and users can also view multiple groups together.
User input is done via text in a simple "programming" language that is specific to Hexagonal Light. The language allows users to create a categorical data groups, create collections of multiple categorical data groups that can be viewed together, and make comments that are ignored by the language "compiler". The user input is compiled and the graph is updated once the user presses the "Create New Graph" button.
Due to displaying every data point without approximating, Hexagonal Light is currently limited to small data sets (under 1000 items is recommended). The website is designed to work both on desktop and mobile, although it is easier to input text on desktop.
Hexagonal Light does not use any code libraries.
Hexagonal Light is my second web application for displaying data, with my first project being Visual Data. I created Hexagonal Light with the goal of making an application that is both more user-friendly than Visual Data and having a better UI design, and I am happy how this project turned out.
Hexagonal Light has the following significant improvements over Visual Data: